This graph displays the area of sea ice coverage off the Labrador Coast and Newfoundland south of 55 N and over the Grand Banks from 1810 to present (2025).
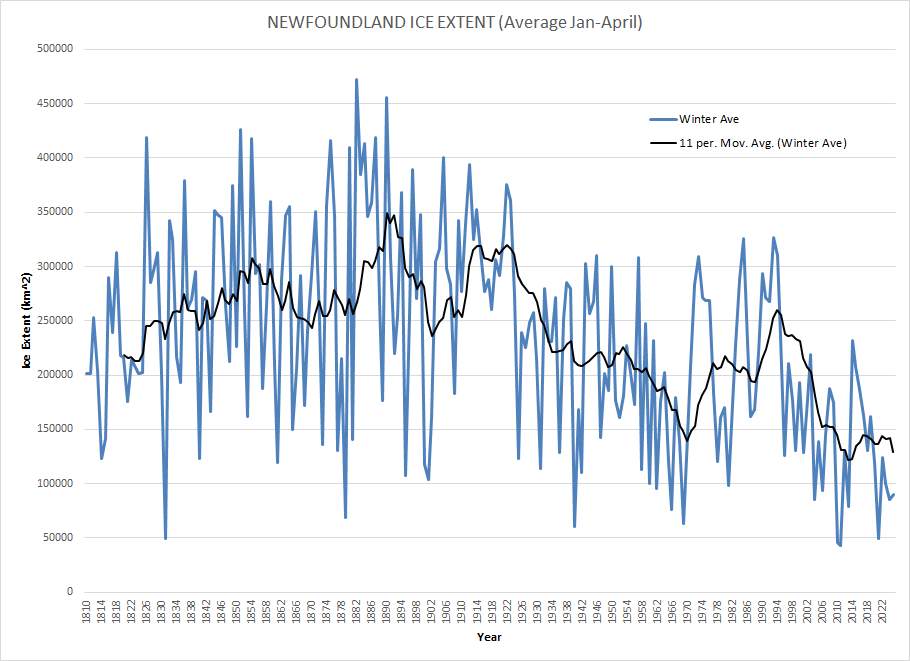
The table below is a sample from the Ice Extent data set. The whole time series from 1810 to present (2025) can be viewed here. The Excel file, including the above chart, can be downloaded here.
| YEAR | Jan/Feb | March | April | Winter Ave |
| 1860 | 321136 | 184709 | 122185 | 209343 |
| 1861 | 105600 | 122311 | 131011 | 119641 |
| 1862 | 321108 | 284416 | 258682 | 288069 |
| 1863 | 354769 | 367187 | 318877 | 346944 |
| 1864 | 391658 | 389048 | 285482 | 355396 |
| 1865 | 152549 | 147750 | 149953 | 150084 |
| 1866 | 271928 | 178998 | 167478 | 206135 |
| 1867 | 171940 | 430819 | 272952 | 291904 |
| 1868 | 235923 | 153896 | 126296 | 172038 |
| 1869 | 351977 | 231546 | 139654 | 241059 |
Ice Reports & Charts
The charts display the ice information as recorded in the available sources. A more detailed description of sources, methodology and abbreviations used in the reports can be found in the Data Description. Briefly, in the charts a small red cross denotes the presence of sea ice. A straight line between two point indicates there was continuous ice between them. The red boundary line is an estimation of the extent of sea ice only. Icebergs are denoted by green triangles and a straight line between two points indicates that there were least three icebergs observed end to end.
From 1810 to 1859 there are only enough ice reports to give an approximate estimation of the ice extent for the whole ice season whereas after that time, sketchy as it might be in the early years, an attempt has been made to estimate the sea ice extent for each of the winter months often with January and February combined, March and April.
(Click on year to view)
Ice Reports prior to 1810
Ice Charts 1810 – 1829
Ice Charts 1830 – 1839
Ice Charts 1840 – 1849
Ice Charts 1850 – 1854
Ice Charts 1855 – 1859
Ice Data Files
The data files contain the geographical coordinates in decimal degrees separately of the sea ice and iceberg reports used in compiling the charts, and also the digitized coordinates of the sea ice boundary line. Coordinates preceded by the number “1” indicate an individual sighting, and if preceded by a “0” indicates it was a line of sightings from the previous value as briefly described above in Ice Reports and Charts.