1.0 INTRODUCTION
With the support of the Program for Energy Research and Development (PERD), IOT’s Ship Iceberg Collision Database was converted and expanded from its original brief text description of some 560 collisions to a Microsoft Access version now containing approximately 670 events, many with full accounts of the collisions, environmental conditions at the time, and damage incurred. Reports are supplemented when possible with description of the ship characteristics, photographs of the ship and damage, and appropriate ice charts showing the location of the accident to known ice conditions at or near the time. Descriptions of the events have come from a variety of sources including accounts from newspapers, books, websites, and from formal investigations, and all events are duly referenced.
The database is limited to collisions that occurred in the northern hemisphere, i.e. in the North Atlantic including the Grand Banks, off the coasts of Canada, Greenland, and Svalbard, and on the coast of Alaska, to the exclusion of collision with Antarctic icebergs in the southern hemisphere. The Grand Banks is normally the area of greatest interest since it lies along the shipping routes from major ports in Europe and North America and lies in the path of the Labrador Current which transports the icebergs from further north, with a peak season in late spring and early summer though icebergs can be found there at any time of year. The earliest record in the database is from the year 1619, in Svalbard, with the majority of incidents occurring in the 19th and 20th centuries and involving almost every kind of vessel from wooden fishing schooners to high speed liners and ballistic missile submarines.
Icebergs, in the context of this database, include all ice descriptions of glacial origin including the smaller bergy bits and growlers to the largest ice islands. Collisions with sea ice, a vast number in itself, have been deliberately excluded, though there are a very few cases where multi-year ice, (pieces of sea ice that have thawed and refrozen over a succession of summers and winters to become almost totally fresh water ice and consequently very hard) have been included, especially in those cases where bergy bits and growlers were likely to have been present anyway and identification would have been a problem.
This report examines the trends of iceberg collisions with time and in different areas of the northern hemisphere. It studies the various types of vessels involved and the damage incurred and investigates any trends in the data when such parameters as vessel speed, iceberg size, accident scenario, and visibility are known. From the number of known iceberg collisions, the number of icebergs, and an estimate of vessel traffic on the Grand Banks a probability of collision can be derived.
Access to the Ship Iceberg Collision Database is available on this website as is the user manual.1
2.0 DATA ANALYSIS
2.1 Geographical Areas
The geographical areas are shown in Figure 1 and defined as:
- 1 All water
- 2 North Atlantic: between lats. 30°N and 60°N and lons. 0°W and 63°W.
- 3 Grand Banks: between lats. 35°N and 52°N and lons. 35°W and 55°W.
- 4 Gulf of St. Lawrence and South Newfoundland Waters: between lats. 40°N and 48°N and lons. 55°W and 63°W.
- 5 Strait of Belle Isle and Approaches: between lats. 48°N and 55°N and lons. 50°W and 62°W.
- 6 Labrador Sea and Davis Strait: between lats. 55°N and 70°N and lons. 48°W and 65°W.
- 7 Hudson Strait: between lats. 55°N and 65°N and lons. 60°W and 80°W.
- 8 South Greenland Waters: between lats. 55°N and 70°N and lons. 25°W and 48°W.
- 9 Baffin Bay Area: between lats. 70°N and 90°N and lons. 50°W and 115°W.
- 10 Greenland Sea: between lats. 67°N and 90°N and lons. 30°E and 25°W.
- 11 Alaskan Waters: between lats. 55°N and 62°N and lons. 130°W and 150°W.
- 12 Unknown: area not described.
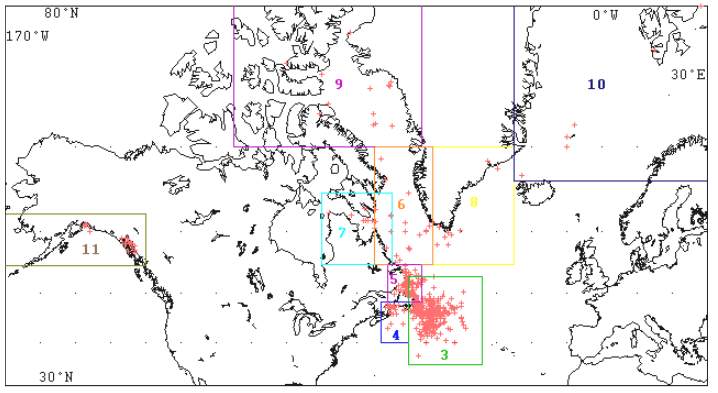
Figure 1 also shows the geographical distribution of the collisions with icebergs. Most of these locations are known with accuracy but several have been estimated based on knowledge of vessel’s route and circumstances. Not surprisingly the bulk of the events occurred on the Grand Banks and Strait of Belle Isle areas in the paths of trans-Atlantic shipping and coastal traffic.
The geographical representation is shown in Figure 2. There is some overlap with the Strait of Belle Isle and Grand Bank areas but it is clear that this combined area is significantly worse for iceberg collisions than anywhere else.
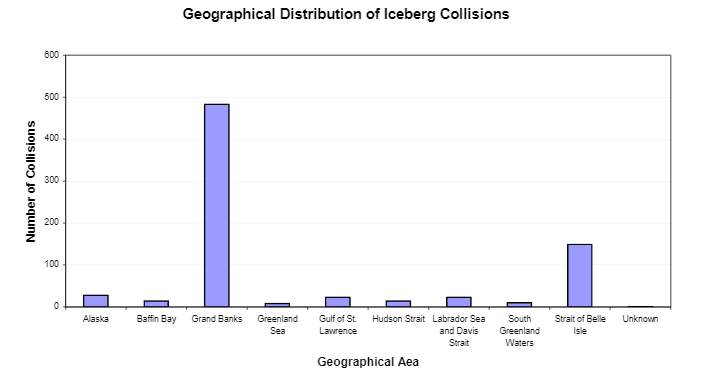
Figure 3 shows the trend in collisions by decade since the early 1800s and compares the trans-Atlantic shipping routes of the Grand Banks and the Strait of Belle Isle with the remaining areas of the North Atlantic. No particular trend is evident for the remaining areas because the number of collisions in these areas is not very high, and the fluctuations could be due to a number of reasons including variable ice conditions, ship traffic and how well the accidents have been reported. However the variation of collisions on the Grand Banks and Strait of Belle Isle areas shows large fluctuations peaking in the late 19th century and waning in the late mid 20th century.
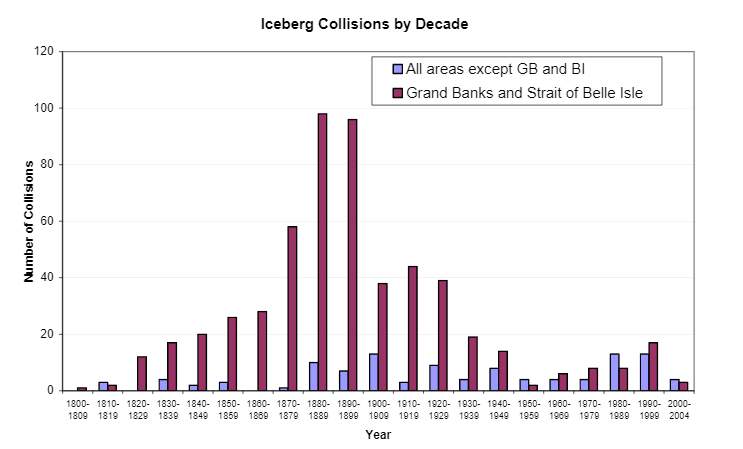
Figure 4 shows this is in more detail and compares the interannual variation with that of the known sea ice extent to the east of Newfoundland south of 52°N and extending towards and over The Grand Banks. The ice extent numbers are from Hill2 and updated with current data from the Canadian Ice Service. At present there is no accurate iceberg count for any of the years during the 19th century but there is a general relationship between the amount of sea ice and the number of icebergs3 with the presence of sea ice preserving the life of the iceberg by protecting it from wave erosion so the ice extent in the figure is a proxy for iceberg severity. A 7 year moving average is used to highlight the overall trends and it is apparent that the late 19th century was a time of unusual ice severity and this period is marked also in the trend of ship collisions as one of high casualties. The overall trends of each are very similar although the number of collisions becomes less with time as a reflection of better iceberg detection and monitoring techniques being developed and employed, particularly with the inauguration of the International Ice Patrol (IIP) after the sinking of the Titanic in 1912, and also with the later introduction of ship borne radar systems after World War II. It is interesting to note that after a long period of severe ice conditions there was a general improvement from the mid-1920s which was followed by two spells of bad conditions, one in the late 1970s and the other in the early 1990s. The return to severe ice conditions in the latter period is also marked by an increase in the number of iceberg collisions.
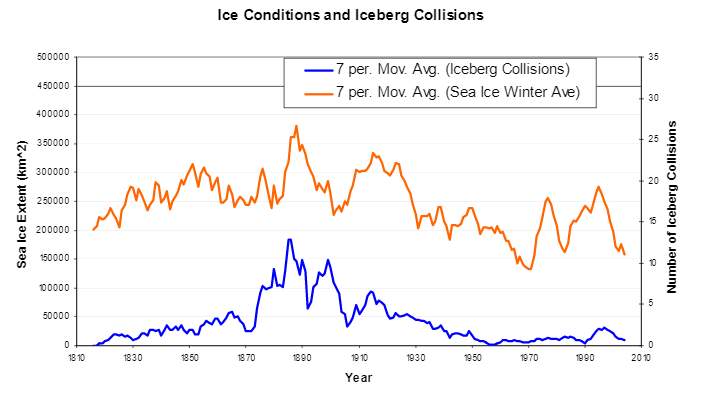
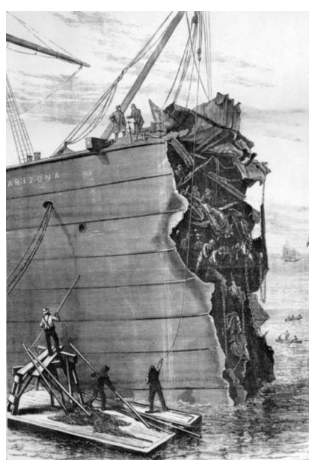
Figure 5 shows the monthly distribution of collisions on the Grand Banks and its adjacent areas of the Strait of Belle Isle and the Gulf of St. Lawrence / South Newfoundland compared with the average monthly numbers from the IIP data set of icebergs crossing south of 48°N for the years 1900 to 2003. As one might expect for the Grand Banks area there is an obvious correlation between the number of icebergs and the number of collisions with them, the numbers rising and falling together during the months with the only exception being in November. The total number of collisions in this month for the Grand Banks area is only 5 and all these occurred in the 19th century. We do not yet have iceberg numbers for that century and it is possible, as seen in Figure 4, with the severe ice conditions that occurred in the latter half of the century there were more icebergs in November than more recently. In fact, study of the IIP data shows 106 iceberg observations in the first half of the 20th century compared with 15 in the latter half so it is quite likely that the month of November in the late 1800s was more hazardous than of late, as evidenced by the SS Arizona, Figure 6, on 7 November 1879 which became one of the most famous ships to have survived an impact with an iceberg at speed (13½ knots).
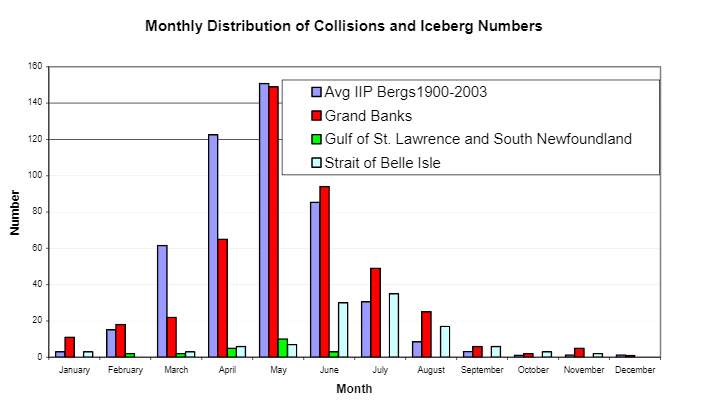
Collisions in the Gulf of St. Lawrence and South Newfoundland area follow a similar monthly trend as the Grand Banks. In these waters icebergs can drift westwards with the Labrador Current around Cape Race and a few can make it down the west coast of the island through the Strait of Belle Isle. Locally rafted sea ice can also cause high piles of floating ice that may be mistaken for true icebergs. In severe ice years Cabot Strait between Newfoundland and Cape Breton may be totally choked with ice until late April or early May.
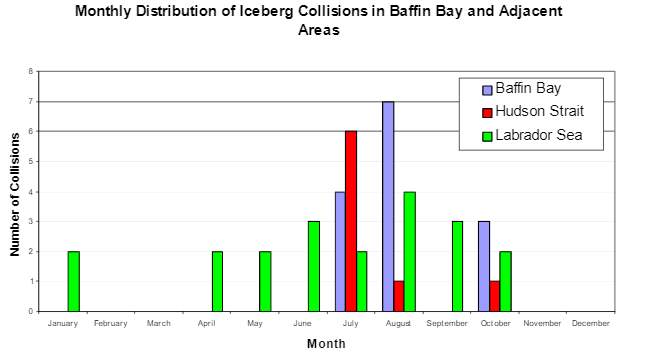
Collisions in the Strait of Belle Isle show a slightly different trend. The northern route through the straits is often used by ship traffic between northern European ports and the St. Lawrence River ports such as Montreal. Traditionally, the Strait of Belle Isle is closed during the ice season which may stretch from late fall to late spring resulting in the trend of iceberg collisions lagging behind those of the Grand Banks and the Gulf of St. Lawrence areas as in Figure 5. Shipping increases as the navigation season resumes, and so does the number of iceberg collisions until the iceberg threat retreats later in the summer. Similar trends for Baffin Bay and Hudson Strait areas are shown in Figure 7. Typically shipping does not open in these areas until high summer and the season is relatively short, traffic consisting mainly nowadays of resupply vessels to the Arctic communities and ore mines, and bulk carriers to the grain terminal at Churchill in Hudson Bay, while in days gone by it consisted largely of whaling vessels and others engaged in Arctic exploration. The collisions in the Labrador Sea area are also largely confined to the summer months. Here, the season is open in the east all the year round while the ice season blocks access to Hudson Strait and Baffin Bay to the north.
Figure 6 SS Arizona at St. John’s after Collision.
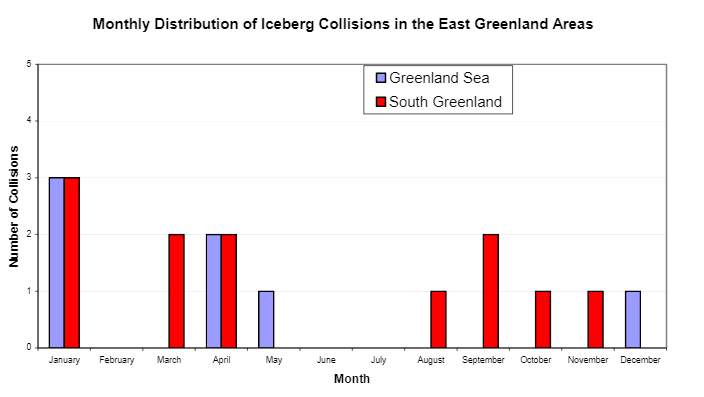
Ship collision with icebergs in the seas to the south and east of Greenland are shown in Figure 8 and are presented more as a matter of interest as the numbers should be regarded as a sample only and not as a comprehensive representation. Source material used in compiling the collision database was largely North American and British whereas this geographical area comprising the waters around East Greenland, Iceland, Jan Mayen and Svalbard were largely Scandinavian. Consequently, it is likely only the more noteworthy of the collisions such as the sinking of the Hans Hedtoft in January 1959 and incurred a large loss of life that reached wider reporting in source documents. Although there were a few events involving whaling vessels in Spitzbergen in the 17th century most of the other incidents have been recorded since 1940, including the wartime loss of the tanker Svend Foyn, again with a large loss of life.
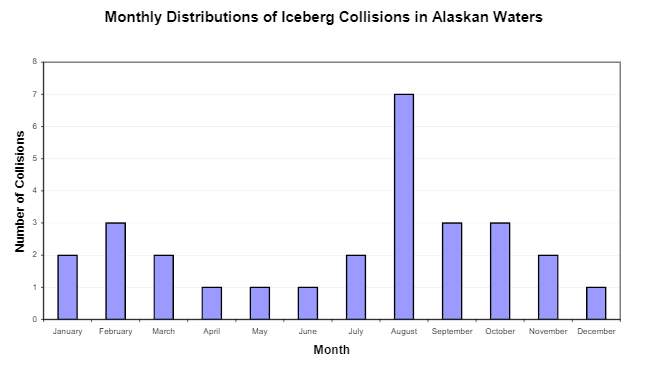
Iceberg collisions in Alaska are shown in Figure 9. The monthly figures mostly fluctuate at low levels between one and three, the exception being the month of August in which a number of summer tourist+ sight-seeing vessels have come to grief.
2.2 Vessel Types
2.2.1 Types of power
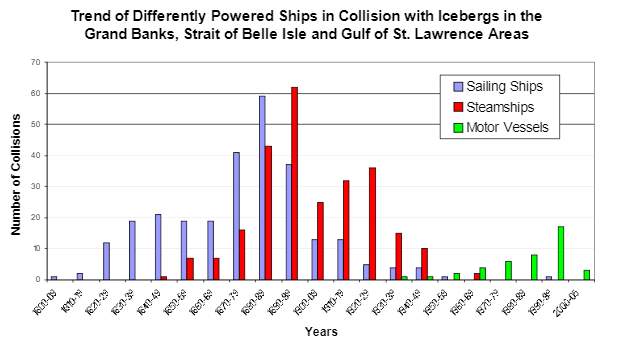
Vessels were sorted into one of the three differently powered types: wind powered (sailing ships), steam powered (steamships), or oil or diesel powered (motor vessels). Many light sailing ships, particularly the wooden fishing schooners, had auxiliary engines of some kind but were still classed as sailing ships. Many of the early steamships carried sail but were regarded as steamships. Figure 10 shows iceberg collisions for trans-Atlantic shipping over the Grand Banks, including the routes through the Strait of Belle Isle or the Gulf of St. Lawrence, involving each of the three kinds of ships and how the collisions with each type changed with time over the two centuries. The overall trend is similar to that as shown in Figure 3. The Savannah, in 1819, was the first steam powered vessel to cross the Atlantic. By the late 19th century screw driven steamships had supplanted the earlier paddle-steamers, and voyages by traditional sailing ships were in steep decline. It was also a time of worsening ice conditions (Fig. 4) which posed an increasing risk to the steamship companies trying to outdo one another in high speed Atlantic crossings. The more recent decades have seen virtually the total replacement of steam powered vessels by the cleaner and more fuel efficient motor powered vessels. The only sailing ship casualty in this modern era was the yacht Stella-r which struck a growler on the Grand Banks during a single-handed boat race.
2.2.2 Types of Vessels
Figure 11 shows the trend in iceberg accidents with vessels of different types which were categorized into 5 types; passenger liners, freighters, tankers, bulk carriers and fishing vessels. Sailing ships were ignored and only steamships and motor vessels were so identified. It is evident that passenger ships took the highest toll around the turn of the century at a time when emigration to North America was also at its highest. It was an unfortunate coincidence that passenger traffic peaked when the ice in the North Atlantic was at its severest and when ships were traveling faster than ever before without the benefit of later iceberg detection and monitoring. The decrease in passenger liner collisions after the 1890s was no doubt partly due to ameliorating ice conditions and later, a decrease in emigration. From the 1920s onward cargo ships, including the later bulk carriers, surpassed the liners in casualties. The last decades of the twentieth century show a slight worsening of ice conditions (Fig.3) and this corresponds to an increase in the number collisions primarily with bulk carriers and fishing vessels. Bulk carriers can carry a wide range of cargoes but when acting as tankers for oil or chemicals, the pollution risk in the event of a collision is high. Omikronventure L carrying 600,000 barrels of crude was a case in point, striking a growler on the edge of the Grand Banks in April 1993 and cracking her hull open, but fortunately not the cargo tanks.
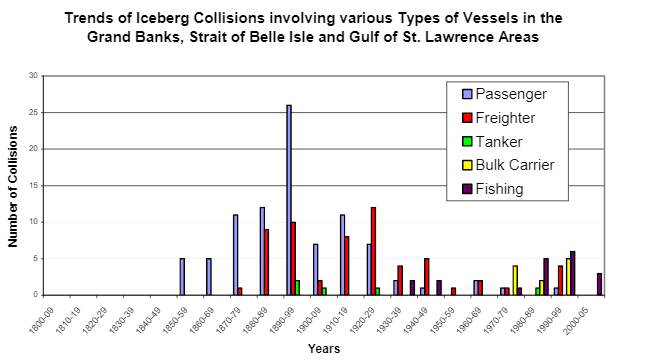
The fishing vessel category includes all kinds of trawlers and draggers although it should be noted that the two incidents in the 1940’s decade were trawlers converted to wartime activities. Fishing schooners were ignored as they were regarded as sailing vessels. It is seen from the figure that modern day fishing vessels are more prone to iceberg collisions than any other type of vessel. Recent examples are the sinking of the BCM Atlantic in March 2000 off the coast of Labrador near the Strait of Belle Isle, and the collision of the Solborg near St. John’s in June 2004. Both were shrimp trawlers, the former actively fishing at the time of the collision, and the latter on way to her port with her cargo. It is the nature of this kind of industry that necessitates these vessels operating in ice conditions.
Figure 12 show iceberg accidents with various types of vessels in areas other than the Grand Banks / Strait of Belle Isle / Gulf of St. Lawrence areas, namely Alaska, Labrador Sea, Baffin Bay, Hudson Strait and the waters to the south and east of Greenland. The plot similarly excludes sailing vessels so the years start with the first steamship collision in the 1890s. The numbers are low in comparison with the Grand Banks areas and because of the remoteness of the areas they see higher proportions of other ship types than the five categories mentioned. These types include vessels such as icebreakers, drillships, research ships, coast guard and other government ships, and tugs. The overall trend of the graph is similar to those seen in previous figures with peaks at the beginning and end of the last century.
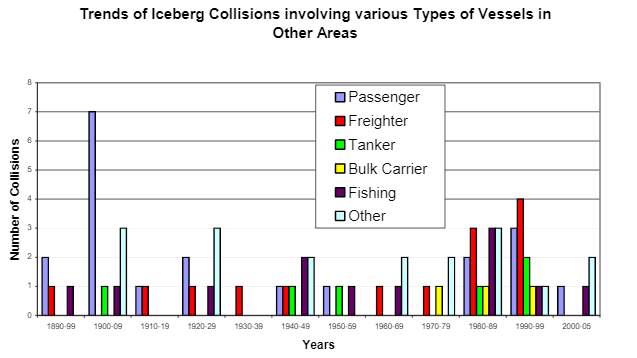
Almost 80% of the iceberg collisions from the period 1898 to 1929 in these areas (Fig.12) occurred in Alaska, a reflection of the volume of traffic spurred on by the Yukon gold rush of 1897 that had to navigate glacial fiords to reach the ports of Juneau and Skagway. The remainder of the vessel casualties in this period was a mix of vessel types that came to grief largely in the Labrador Sea – Davis Strait area. The rise in collisions towards the end of the time frame shown in the plot could be partly due to the better reporting of accidents and the relative ease of finding source material in the recent period, but probably also indicates increasing traffic to the remoter areas. Four of the six passenger ships to collide with icebergs within the last 20 years were small tourist sight-seeing vessels, such as catamarans, in the fiords of Alaska, while the fifth, the Alla Tarasova, likely also on a cruise was damaged by multi-year ice or a growler in Frobisher Bay in the Hudson Strait area. All the freighter and bulk carrier collisions in the past 30 years have been on the Canadian routes through the Labrador Sea, Davis and Hudson Straits and Baffin Bay, and represent a portion of the traffic resupplying Arctic communities, or ferrying equipment, grain or ore in and out of the various mines and ports. Six tankers have been in collision with, or because of, icebergs in ten decades, three of them in Alaska. Though it did not collide with an iceberg, the Exxon Valdez, has been included because it went aground trying to avoid icebergs in the narrow shipping lanes, and of the huge consequence of the resulting pollution of the eleven million gallons of crude oil spilt after the hull was torn open on the reef. While other tankers were damaged or sunk the only other tanker likely to have caused pollution was the wartime converted whaler, Svend Foyn, which sank with 20,000 tons of high octane fuel after striking an iceberg off Cape Farewell in March 1943.
2.2.2.1 Ice strengthened ships
There have been a number of iceberg collisions with Canadian Arctic Class (CAC) category ships and of the Arctic Shipping Pollution Prevention Regulation (ASPPR) type ships. Two incidents with CAC4 icebreakers have been recorded both with minor or no damage. The CCGS Des Groseilliers damaged her bow while trying to nudge an iceberg out of the way of another ship. The CCGS Louis S. St-Laurent had a peculiar encounter in 2001 when it just scraped by an iceberg at slow speed in Nares Channel. The low iceberg was heavily covered, and thereby weighted down, by a heavy and almost total cover of dark rocks that made the iceberg almost totally invisible in the foggy conditions at the time, nor was it picked up by radar. At least eight incidents are known with ASPPR Type A and B ships. Apart from one with an unknown iceberg size they were all impacts with small ice pieces such as either bergy bits or multi-year ice, and the seriousness of the damage varied from denting of plates to the sinking of the ship as in the case of the Finnpolaris in 1991.
2.2.2.2 Vessels – Drillships, yachts and submarines
Types of vessels other than the traditional fishing, passenger and cargo vessels have collided with icebergs. From the early 1970s the east coast of Newfoundland and Labrador has seen much offshore oil and gas exploration with many drill ships and platforms working in the area commonly known as iceberg alley. During drilling operations in 1982 the drillship Pacnorse was struck by a small drifting iceberg at about ½ knot doing some minor damage.
While there have been encounters between yachts and icebergs in the southern sub-Antarctic waters the only known incident in the northern hemisphere was in June 1982 with the previously mentioned single-handed Stella-r during the Observer Single-handed Transatlantic Race in which the yacht struck a bergy bit or growler doing some damage to the bow. A variety of naval vessels including destroyers, anti-submarine trawlers, tankers and cutters have become casualties over the years particularly during the war and post war years in waters close to Greenland either as part of convoys or patrols, or installing and resupplying the several military bases in Greenland. However, a number of nuclear powered, and in most cases ballistic missile submarines, appear to have been in collision with icebergs. Seven likely incidents have been identified though details in most cases are very sketchy and they include, HMS Warspite in 1968, HMS Tireless in 2003, USS SSB-644 Lewis & Clark in the mid 1960s, and the Russian nuclear powered ballistic submarines K-460 and K-475 both in 1988, and an earlier event with the K-27 in 1968 though this so-called iceberg event may have been a cover up for a faulty reactor which killed nine people, after which the submarine was finally scuttled in 1981 when declared irreparable. The account of K-279 in 1983 or 1984 is the most detailed and describes an impact 190 meters below the surface. A conventional submarine, the German U-boat U-861, is believed to have struck an iceberg south of Greenland in 1945.
2.3 Fatalities
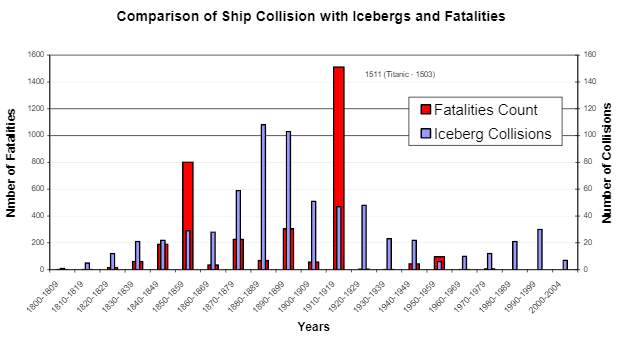
Figure 13 shows the distribution of known fatalities since 1800, some 3,422 in all, more than twice the toll of the Titanic. This number is probably conservative as scores of others must have perished amongst the icebergs from vessels for which there is no record. By the same token, the numbers include those from ships whose true fates are unknown but are traditionally attributed to loss by icebergs and involved large numbers of fatalities. Such examples are the City of Glasgow with the loss of 480 in 1854, the Pacific with the loss of approximately 200 persons in 1856, the City of Boston with the loss of 177 in 1870, and the Naronic with the loss of 74 in 1893. Even excepting these, the number of fatalities are large and if one were to include all accidents caused by impact with ice floes, or crushed in the pack, the numbers would probably more than double.
The trend shown in the figure generally follows the trends in collisions and ice severity as seen in the previous figures at least up until 1910-19; the more severe the ice conditions leading to more collisions and more fatalities. The magnitude of the Titanic disaster is quite apparent and is exceptionally large compared with anything before or after. There were eight other known fatalities that decade, six died on fishing schooners and two were crushed in the bow of an ocean liner. Since the Titanic the next collision with a large number of fatalities was the Svend Foyn in 1943 with the loss of 43 souls. The collision was due in part to war conditions when the convoy in which she was part was routed north close to Greenland to avoid detection by the U-boat packs which concurrently devastated two convoys further to the south. The next fatality was the Hans Hedtoft, a passenger /cargo ship operating between Denmark and Greenland, and was on the return portion of her maiden voyage when she struck an iceberg in a blinding snow storm off Cape Farewell in January 1959 and went down with all hands for the loss of 95 lives. Just as the sinking of the Titanic was the final motivation for the much needed International Ice Patrol for the Grand Banks, so to was the Hans Hedtoft in the formation of the Greenland Ice Patrol. The Hans Hedtoft had seven watertight compartments and a double hull. The Islander, which sank in Alaska in 1901 with the loss of 42 lives, and the Titanic both with watertight compartments were ships that were proclaimed as being unsinkable. The Hans Hedtoft was the last passenger ship to sink with fatalities after an iceberg collision. The last known ship of any sort to suffer fatalities was the refitted Canadian cargo ship Aigle d’Ocean that sank off Port Burwell, Quebec in 1975 with the loss of 4 crew and 2 helicopter airman trying to effect a rescue. Ice was not seen as a contributing factor in the Canadian Coast Guard report but bergy bits had been seen earlier and in popular opinion remains the cause of the sinking. Curiously, while the Titanic and Hans Hedtoft were on portions of their maiden voyages, the Aigle d’Ocean was on its last scheduled trip before being scrapped. The plot illustrates the large drop in fatalities since the loss of the Titanic. Better iceberg detection and monitoring programs were undoubtedly a contributing factor as well as improved technologies in materials and the construction of ships together with faster and more efficient rescue services.
2.4 Ship Damage
2.4.1 Damage severity
From the database, 26% of all vessels in collision with icebergs have sunk, which includes 35% of all sailing vessels and 20% of all steamships and motor vessels. Table 1 shows the breakdown according to damage severity for each of the two principal types of vessel with sinking being rated the most severe, and no damage the least, and other types of damage being graded somewhere in between assigning a numeral to the damage description as listed in the table The damage severity was estimated from the accident reports which in many cases were all too scanty and provided little information.
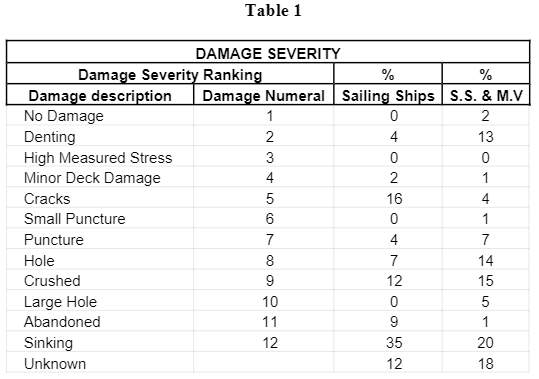
From the table it is interesting to note that there are no sailing ships with large holes; they did not survive; they sank or were abandoned. Since sailing ships and the early steamships often lacked any kind of subdivision beyond the normal collision bulkhead in the bow any flooding in the hull which could not be stemmed, contained or pumped out would eventually sink the ship. Some ships were, therefore, hastily abandoned after a collision without waiting for the final outcome to become clear. Occasionally some of these floating casualties were subsequently found derelict and waterlogged and were then deliberately sunk to remove them as a floating danger. A very few were found almost intact as in the case of the brig Resolven in 1884.
When referring to iron and steel ships in Table 1, “cracks” describes cracked plating, but when referring to wooden ships and early iron vessels (which still carried wooden masts) describes cracked off appendages such as bowsprits, cutwaters, bulwarks, railings and figurines the loss of which may have resulted in some loss of sailing ability but did not directly affect the overall integrity of the ship. The definition of crushing is used in events such as the staving of bows or other part of the hull often with the ingress of water but normally confined within the forecastle or collision bulkhead, and applies equally well to all kinds of ships. That non-sailing vessels had a slightly higher percentage of crushed events than sailing ships was likely due to the better ability of iron and steel ships to survive a crushing impact without being holed. Similarly with denting; an impact which dented a metal hulled vessel was likely to stove a wooden one.
Over 60 steam and motor vessels, approximately 20% of all vessels since 1850, are known to have sunk. For each decade the total number of the vessels sunk in all areas as well as for the types, Passenger, Freighter, Tanker and Fishing are shown in Figure 14. The totals shown may exceed the sum of the types as the totals include other or unknown types. The total number of ships sunk per decade is remarkably constant through most of the time frame the main exception being in the decades leading up to the end of the 19th century which, as discussed, was a period of high traffic and severe ice conditions.
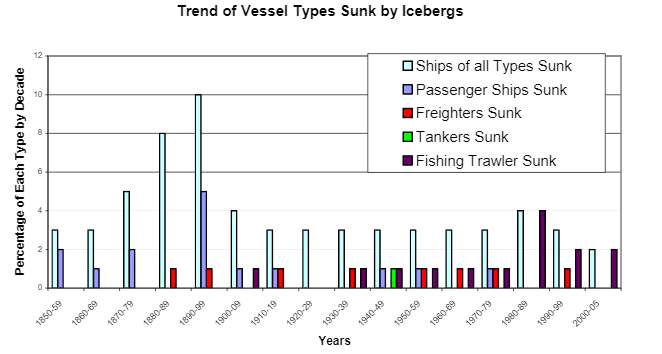
After the loss of the Titanic in 1912 there were no further losses of passenger ships until the war years when the German Bahia Blanca, perhaps more a cargo than a passenger ship struck an iceberg in Denmark Strait off Iceland and went down the following day. The Hans Hedtoft sank in 1959 and the William Carson in 1977, perhaps due to a collision with a heavy multi-year ice floe. The details of the Bahia Blanca collision are unknown but there were similarities with the other three vessels in how they sank (see 2.4.2 Damage scenarios). A number of freighters and one tanker have sunk in that same period, and though there have been a number of collisions with bulk carriers none have been lost. Sinkings of fishing boats are higher in the last 25 years than they have been before.
2.4.2 Damage scenarios
Table 2 summarises the approximate 370 collisions of all types of steam and motor vessels in regard to the severity of damage incurred in a number of different accident scenarios. Unfortunately, about a third of all scenarios are unknown and about a fifth of the damage severities are unknown. The numbers show that the most likely outcome of collision with an iceberg is some kind of holing and the most likely cause of that is some kind of direct impact. However, in the 18 cases of sinking where the scenario is known then some kind of indirect impact was the factor. These include; a glancing blow, as in the cases of the Titanic and Hans Hedtoft; striking a growler or bergy bits concealed in waves or pack ice, such as in the case of the BCM Atlantic which struck a bergy bit on the fore part of the hull; grounding or running up on an underwater ledge of an iceberg thus holing the bottom of the hull; being caught at anchor or in pack ice and having a berg or bergs crush along the beam.
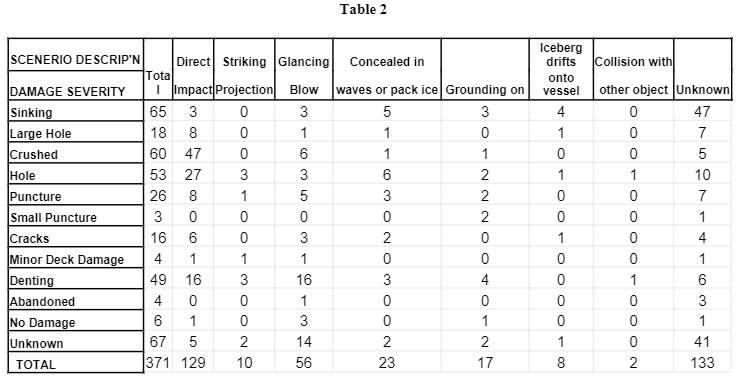
The data in Table 2 was simplified and condensed for display in Figure 15 by grouping three similar scenarios together (Striking Projection, Glancing Blow, Concealed in Waves/Pack Ice) and calling it Indirect Impact. The various hole and puncture types were combined into two groups, Holed and Punctured. Crushing of bows or bow appendages such as bowsprit and figureheads were the most common result of any direct collision. The next most frequent damage was some kind of serious holing. Denting from Direct and Indirect Impacts were the next most common result, followed by holing by Indirect Impact and then by puncturing. It is emphasized that “pigeon holing” damage scenarios and severities, often from scanty reports, is subjective but gives some indication of the severity of the damage and the figure illustrates the damage sustained in a number of different scenarios.
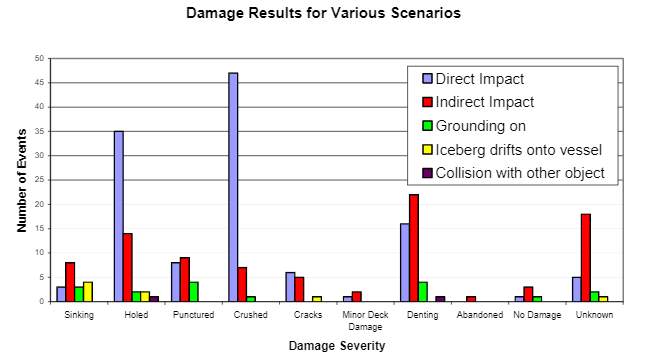
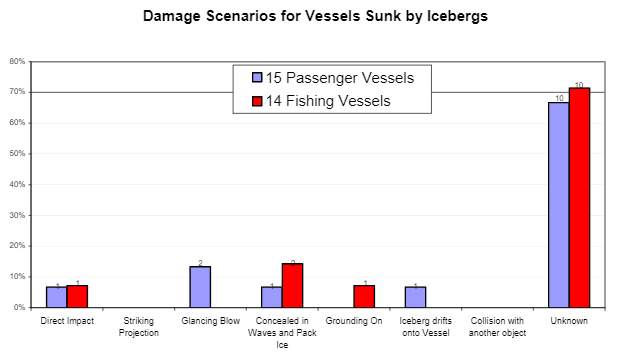
Figure 16 shows the relative percentages of passenger vessels and fishing vessels sunk in the various scenarios. The sample size turns out to be disappointingly small with only nine scenarios in the 29 events being known. One vessel of each type was sunk by direct impact; the passenger ship Islander in Alaska and the fishing vessel Vanguard also in Alaska. In each case the vessel struck at high speed. The wooden hull Vanguard was split open, the port bow was torn off the Islander The only other steamship, likely a freighter, to have been sunk by direct impact was the Pera whose hull was cut through to the foremast. Materials and methods of construction obviously change with time so any kind of analysis of would have to take this into account.
2.4.3 Falling and dislodged ice and rolling bergs
Ice dislodged from high on the iceberg at impact and falling on to the ship appears to be fairly common, the recent case of the Solborg (Figure 18) being an example, and according to the anecdotes, passengers onboard the Titanic added ice that had fallen to the deck to their drinking glasses before the seriousness of their situation became known. These appear to be relatively minor ice falls but there at least 17 other known cases and some of these caused fatalities and with a hundred of tons or so of falling ice were enough to threaten the ship. Two men on the deck of the Montrose were killed by falling ice after it struck an iceberg in fog in 1928. About 150 tons of ice fell on the decks and into the holds of the SS City of Berlin after collision in 1885 where some of it still remained at the time of docking. When the bark Condor struck a berg in 1880 two men on the main mast were thrown to the deck and one of them had his legs crushed when ice from the berg came falling down on top of him. So much ice fell on the bow of the SS Hurworth, also in 1880, that the stern was lifted high and dry and the ship was in danger of pitching under. The SS Beacon Light got it from all sides after collision with an iceberg on her maiden voyage in 1890. Trying to turn the berg she struck a projecting ledge a glancing blow tearing away parts of her forecastle and the force of this together with the impact of a 50 ton piece of ice falling on the foredeck almost turned the vessel on to her beam ends. This was immediately followed by a large piece of ice breaking off from below and coming up and smashing into the hull. In a locally famous case, in July 1890 in Notre Dame Bay, Newfoundland, the 1200 ton Portia sailed too near to a large iceberg when it suddenly broke up and a huge piece of ice came up under the vessel lifting it high and dry twelve feet out of the water, its fate literally on the balance until it settled back into the water with little more than a few damaged plates and a slight leak. The bark Moen was not so lucky. It struck a large iceberg and jammed solid in it losing one man. The remainder of the crew had just taken to the boats when the berg toppled splitting the vessel in two.
2.5 Weather
2.5.1 Visibility
Visibility is obviously an important factor in any collision. If an iceberg was spotted under clear conditions then, of course, it would be avoided. In the Grand Banks area of the North Atlantic where the cold waters of the Labrador Current meet warmer waters and warm moist air, fog is a persistent problem. In many accounts icebergs have not been so much hidden in the fog as to have actually been mistaken, in the misty conditions at the time, for a fog bank or thickening mist, until too late. Of the approximate 370 steam and motor vessel collisions descriptions of visibility is known in only 42% of them, and in terms of actual distance only 5%.
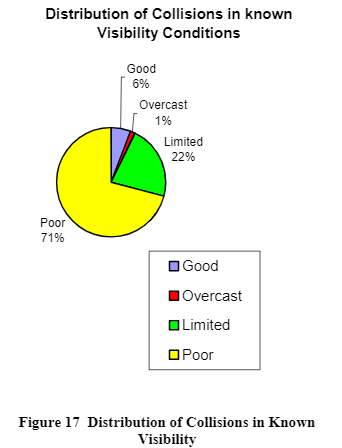
Figure 17 shows the relative percentages of the various degrees of visibility. The events that occurred in conditions of good visibility were largely impacts with growlers or bergy bits concealed in fields of ice through which the vessel was navigating. In some of these cases the damage scenario is unknown while the one that involved the icebreaker Des Groseilliers happened while trying to nudge an iceberg with her bow away from the vessel she was escorting. There were also a few instances when the visibility was good, in the order of 10 or 25 miles, but in low light which helped obscure low lying bergs, as was the case of the Manchester Commerce which hit at full speed. Almost all of the collisions that occurred in good visibility happened within the last 20 years perhaps indicating better detailing and documentation of accidents, or perhaps indicating higher speeds with less chance to detect and react. There are six records with visibilities in the one to seven nautical mile range, corresponding to the Limited category range, and of these, four became casualties upon striking concealed bergy bits or growlers in waves or pack ice. Of the remaining two, the Canadian Bulker struck a sizeable berg on a clear night and the Knight Bachelor struck a low lying berg in variable misty conditions.
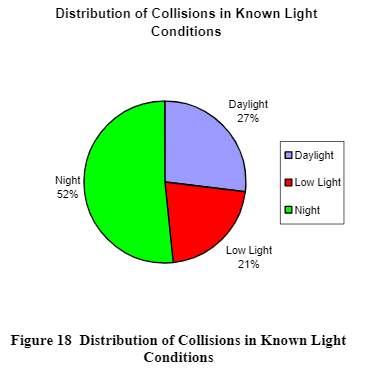
Only 89 of the 370 vessel collisions, less than 25%, have information regarding time of day as to day or night or twilight. The proportions of these are displayed in Figure 18, showing that the majority of the collisions occurred during the night time hours, a logical circumstance. Mist or fog was present in 87% of the time when visibility was known to be impaired, snow 10% of the time and rain 3%. Almost all the collisions that occurred in daylight happened in foggy or snowy conditions except for one instance of striking a concealed bergy bit, and another one unknown. Night in itself is an obstacle to clear vision and almost half of the known night time accidents were unknown as regards further obstructions, but for the majority mist and fog were present. The exceptions include the well known case of the Titanic which struck on a clear starlit but moonless night; the Hurworth in 1880 which collided similarly assuming the looming iceberg was an overhanging cloud in an otherwise clear and starlit night; and the OOCL Challenge which struck a concealed bergy bit in rough seas. Icebergs in night and fog are a serious hazard and are hard to detect visually, increasing the reliance on Radar. Bergy bits and growlers half hidden in breaking seas, or field ice in bad weather, are hard to detect both visually and by Radar. A further complication, as befell the Solborg in 2004, at night in fog on fishing grounds not far from St. John’s was the inability to identify the Radar return signal of a small iceberg from those reflected by nearby fishing buoys mounted with Radar reflectors.
2.5.2 Sea state
Apart from conditions of ice covered waters, there are only 36 collision events in which the sea state was known, a little under 10%, and they are equally distributed between the three categories, calm, rough and moderate. Moderate and rough conditions were evidently a contributing cause in several accidents by concealing smaller ice pieces especially where visibility was already reduced by fog, snow, or darkness as in such cases as the BCM Atlantic and the Omikronventure L. Speed in rough seas, even in good weather, can also be a contributing factor giving less time to respond to partially hidden ice pieces, as in the case of the Terra Nova in 1990 and the OOCL Challenge in 1993. Rough seas appear to be the main factor in at least two cases. In 1884, the Annerly was trying to round an iceberg when the rough seas dropped her directly on to an underwater spur piercing her hull. Almost exactly one hundred years later a similar event occurred to the stern trawler Ocean Prawns causing her to sink. It is interesting to note that calm water was thought to be a contributing cause in the sinking of the Titanic as waves breaking on the iceberg ahead would have been visible and alerted the lookouts and officers in sufficient time to turn the ship. Perhaps that would have been true in other cases, too.
2.6 Vessel Speed
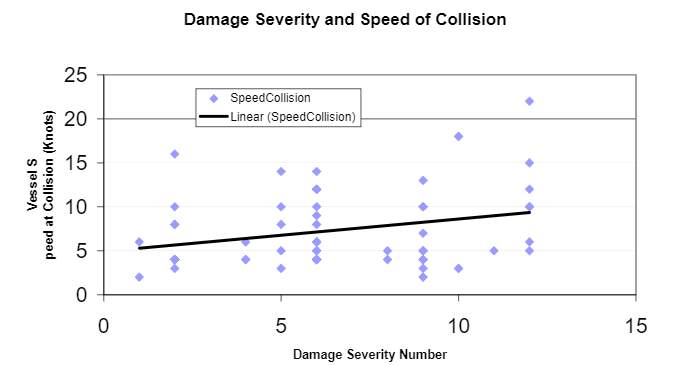
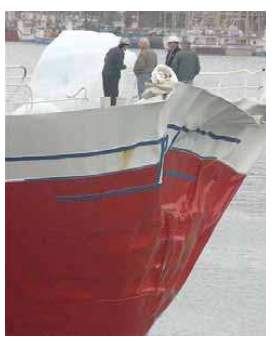
Of the 370 steam and motor vessels collisions there are only about 70 of them in which the speed at the time of collision was known. Neglecting small vessels such as fishing vessels and stationary vessels and limiting the selection to those cases in which the damage severity was known this number was thereby reduced to 58. Vessel speed is plotted against the Damage Numeral as assigned in Table 1 in Figure 19. The trend is, not surprisingly, one of increasing damage with increasing speed though there is a large amount of scatter and it can be seen that even at relatively low speeds sufficient damage can be sustained to sink the ship. The William Carson went down in 1977 while travelling at about 5 knots in a heavy ice field and presumably hit a heavy ice piece such as a multiyear ice floe or a bergy bit. In 1932, the Bright Fan sank in Hudson Strait after grounding on an underwater ledge of an iceberg at a speed of only 6½ knots. However, the Kronprinz Wilhelm struck a small iceberg a glancing blow at 16 knots scattering 20 tons of ice across the decks and knocking both passengers and berg over, suffering little more than a badly dented bow and some scraped paint. Fishing vessels were excluded from this plot because of their smaller displacement and typical lack of subdivision and for many of these the speeds were unknown. Even in the recent case of the Solborg, which suffered a dented bow and collected a piece of iceberg on deck (Figure 20), the exact speed at time of collision is unknown. Cruising or service speeds are known for another 70 or so vessels that could allow an estimate of collision speed to be made based on the accident descriptions.
Figure 20 F/V Solborg with a piece of iceberg on deck.
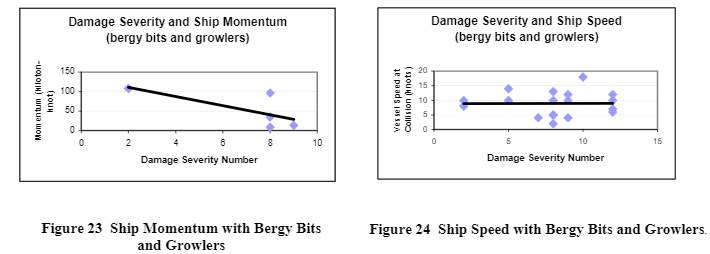
Figure 21 was an attempt to see if ship momentum could be correlated with damage severity. Only data from direct impact collisions were used. Vessels whose displacement was known at the time of collision were very few so the gross registered tonnage was used though provided not quite so accurate a measure of the actual mass. Even using these data there were only 24 events and these were plotted against the damage severity numeral. The figure shows a trend of increasing damage with decreasing momentum which maybe is not quite what one might expect.

The data was filtered to exclude bergy bits and growlers, which because of their comparatively small size may interact differently from the larger icebergs. This resulted in a reduced sample size of 18 events and these were plotted in Figure 22 which does show a trend of increasing damage severity with increasing momentum. Data for the bergy bits and growlers were then plotted in Figure 23 and the trend showed decreasing damage with increasing momentum, though the sample size of 5 was very small. Ship collisions with bergy bits and growlers for all damage scenarios, not just direct impacts, were plotted in Figure 24 and the trend showed no change in damage severity in relation to speed at impact. These plots highlight that despite the large number of collisions in the database there are considerable gaps in some of the data that could be really useful. Also, there is great subjectivity in ascribing a severity value to the known degree of damage and this in itself could lead to a large amount of scatter.
3.0 PROBABILITY OF COLLISION
Basically, since 1980, in a period of 25 years, there have been 57 incidents involving icebergs in all areas of the northern hemisphere giving a rate of 2.3 events per year, or a little over 1.1 for the Grand Banks – Strait of Belle Isle area.
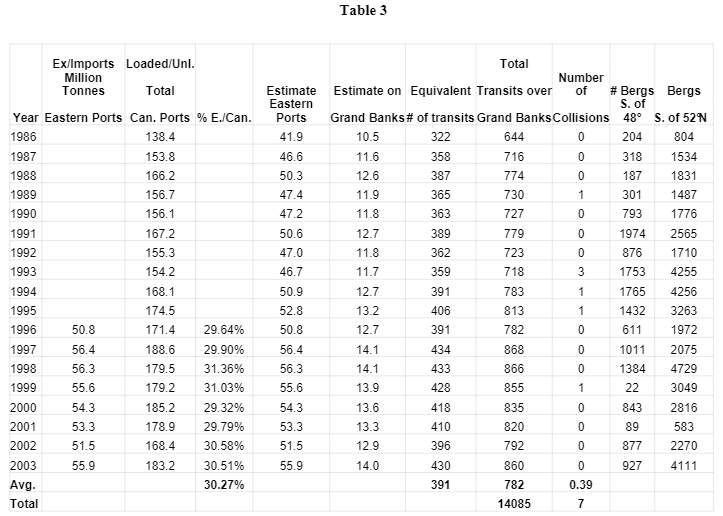
To determine the probability of collision for a ship crossing the Grand Banks the amount of traffic has toe known as well as the number of collisions. As far as is known, there is no accurate assessment of the amount of traffic on the Grand Banks so an estimate had to be derived. Recent annual reports on transportation in Canada by Transport Canada and available on their web site4,5 have statistics on he amount of cargo loaded and unloaded from different sectors of the worlds at eastern and western ports, so the annual tonnage exported from eastern Canada to Europe and he tonnage imported from there is known from 1996. Also known from 1986 is the total tonnage loaded and unloaded in Canadian ports. By comparing these numbers from 1996 the tonnage Europe – Eastern Canada was consistently about 30% so this average was used in determining Europe – Eastern Canada tonnage from 1986 to 1995 to give a total time series of 18 years data from 1986 to 2003. Assuming half the tonnage was to or from northern Europe through the Strait of Belle Isle or over the Grand Banks, and the other half was from or to southern Europe avoiding iceberg infested waters, the tonnage for each year halved. Since the iceberg season is basically half a year from February until August this number was halved again. The IIP, using a similar method of estimating the number of cargo vessels over the Grand Banks to the U.S. used an average cargo capacity of 32,500 tons6. This gives an average equivalent of 391 voyages to and from Canadian ports which is in agreement with the IIP estimate of an average of 382 voyages for 1991 and 1992 over the Grand Banks to and from U.S ports. The figures for eastern Canada, therefore, were doubled to give a total estimate number of voyages for North America over the Grand Banks. All the figures and steps in the calculation are shown in Table 3 along with the number of iceberg collisions involving cargo vessels (all others including fishing and coastal vessels were excluded) south of 52°N, the number of icebergs south of 48°N from the IIP, and the number of bergs, excluding resights, south of 52°N from the PERD Iceberg Sightings Database. The total number of transits over the 18 year period is 14085 and the total number of collisions is 7. This gives a probability of collision of 0.05%, or, we can expect a collision once in every 2000 cargo vessel voyages.
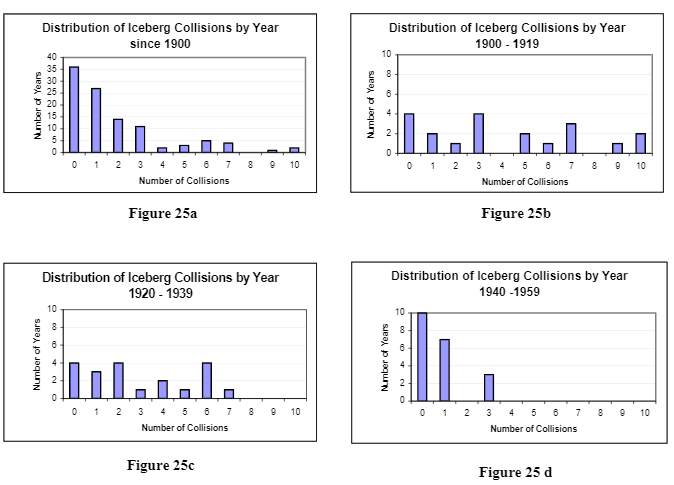
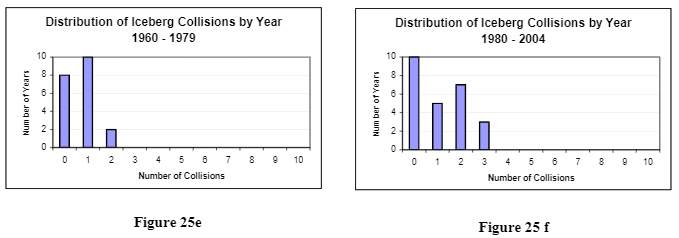
The distribution of iceberg collisions for the Grand Banks – Strait of Belle Isle area south of 52°N is shown in Figures 25a – f. Figure 25a show the distribution for a number of collisions by number of years for the period 1900 to 2004. Figures 25b – f show the distribution for each successive 20 year period (except for the last which is 24 years) starting with 1900. It is interesting to note how the distribution has changed with time from the early 1900s when 9 or 10 collisions in a year were just as likely to happen as 1 or 2. The chart for the 1920s-30s shows a reduction or total absence of years with a large number of collisions, i.e. > 6. The subsequent plots starting in the 1940s show a significant change in the distribution and number of collisions which coincides with the technical advances in iceberg detection and observation techniques being made at the time with the introduction of aerial observation and radar detection.
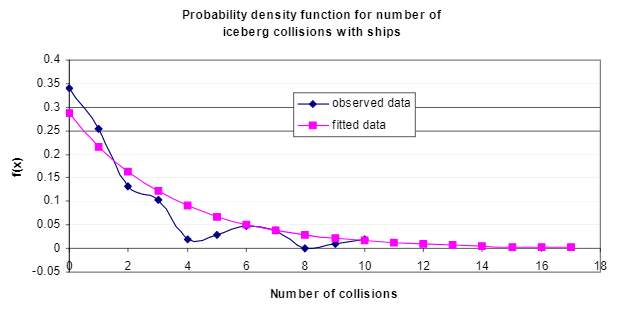
The probability of iceberg collisions can be estimated from the distributions and taking thomplete data set from 1900 (Fig. 25a) as an example, an exponential distribution of probability density function,

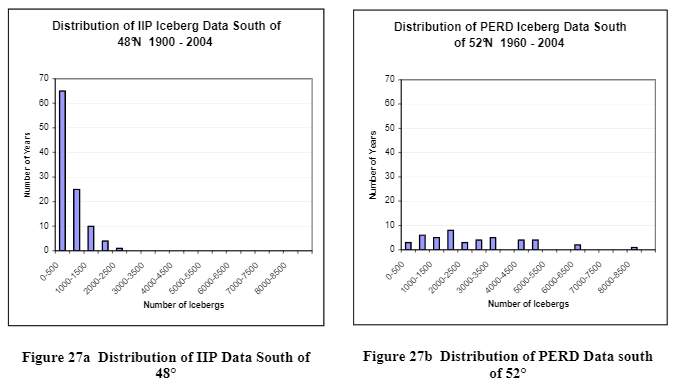
The iceberg numbers in Table 3 are shown for to give a general idea of their magnitude and variability. The distribution by number of icebergs from 1900 for the IIP data and from 1960 for the PERD data is shown in Figures 27 (a) and (b) respectively.
4.0 SUMMARY AND CONCLUSIONS
The Ship Iceberg Database describes over 670 incidents in the northern hemisphere most of which occurred in the waters around Newfoundland in and around the Grand Banks, the Strait of Belle Isle, along the south coast of Newfoundland and in the Gulf of St. Lawrence. Not surprisingly, the number of collisions is well correlated with sea ice and iceberg severity with most accidents occurring in the peak iceberg season of May and June but the data points to more severe and lengthier seasons towards the close of the nineteenth century and the start of the next.
The tren of collisions from the era of sailing ships through those of steamships and motor vessels is shown and it is with the latter two types of powered ships that further analysis was performed. For vessel types where known, these were grouped together as passenger ships, freighters, tankers, bulk carriers or fishing vessels. As passenger traffic declined through the years so did the number of collisions and now they are less likely to happen than those involving freighters, bulk carriers, and fishing vessels. Passenger ship iceberg collisions are presently limited to coastal ships and tourist vessels and there was a recent slight increase with other types during years with worse than average ice conditions on the Grand Banks, and with increasing traffic to Arctic and sub-Arctic area. There have been no fatalities since at east 1975 when the converted cargo ship Aigle d’Ocean sank with the loss of four crew and two rescue airmen.
Since 1850, over 60 ships or approximately 20% of all steam and motor vessels in collision with icebergs have sunk. The Titanic sank at a time when the survivability of ships after impact was already very high. Fishing vessels are prone to sinking with a 50% loss after collision, no doubt due in part, to their lack of subdivision to contain serious flooding. As might be expected invisibility of he iceberg was an important factor in almost all of the collisions whether it was due to fog or snow, darkness or heavy sea state, with 94% of all collisions occurring in visibility conditions less than good and 73% during night or twilight hours. All the collisions with ASSPRI type ships that were damaged with know ice types occurred with small ice masses such as bergy bits and pieces of multi-year ice.
Despite the large number of events, many important details at the time of collision are missing. This is particularly evident when trying to correlate damage with forces at the time of collision where vessel speed, displacement, iceberg size and good damage descriptions are all required. Such instances when all the details are known are few and the sample size is thus quite small. Consequently, attempts to correlate damage severity with vessel speed or momentum in head on collisions were non-conclusive.
In the last 25 years there have been 57 collisions with icebergs in the northern hemisphere for all vessel types giving a rate of 2.3 per year, or a little over one per year in the Strait of Belle Isle – Grand Banks area. An estimate of the annual number of cargo ships over the Grand Banks was made, and from that a probability of an iceberg collision of 0.05% was derived, or one collision for every 2000 cargo vessel voyages. Probability density function of the number of collisions on the Grand Banks from 1900 provides a probability of 0.251 for there being less than one iceberg collision, or one collision every 4 years.
5.0 REFERENCES
- Hill, B.T. Ship Iceberg Collision Database Operations Manual. Institute for Ocean Technology, LM-2004-33
- Hill, B.T. Historical Record of Sea Ice and Iceberg Distribution around Newfoundland and Labrador, 1810 – 1958 Conference and Workshop of Arctic Climate Systems Study: Sea Ice Charts of the Arctic, Seattle, 1998. WMO/TD No. 949; IAPO Informal Report N0. 3. LM-1998-02
- Marko, J.R., D.B. Fissel, P.Wadhams, P.M.Kelly, R.D.Brown, 1994: Iceberg Severity off Eastern North America: Its Relationship to Sea Ice Variability and Climate Change. Journal of Climate, V7, pp1335-1351
- http://www.tc.gc.ca/pol/en/report/anre2004/add/taba815.htm [Nov., 2021, no longer valid address]
- http://www.tc.gc.ca/pol/en/report/anre2004/add/taba813.htm [Nov., 2021, no longer valid address]
- Pritchett, Clarke W. Economic Value of the Ice Patrol. (Nov.,2021, currently available at: https://apps.dtic.mil/sti/pdfs/ADA323740.pdf