Overview
The data are compiled in a number of Excel files, one for each year, in 38 columns, or fields, which are described in detail below. The iceberg records are not necessarily in chronological order. While the IIP numbering system is typically in chronological order records from other sources are numbered sequentially in the order of data entry.
Data Format
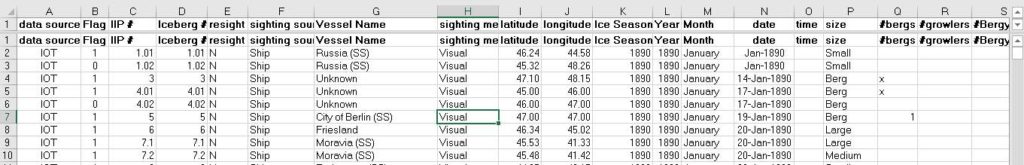
Column A, Data Source
is always the Institute for Ocean Technology (IOT), of the National Research Council Canada
Column B, Flag
“1” in this column denotes the record as an individual record. “0” indicates that it is linked to the previous record as in so many icebergs having been seen between the two (or more) locations. May also be used to describe so many icebergs within a given area such as a triangle or rectangle in which case the last position is the same as the first. This flagging can be useful in some plotting programs.
Column C, IIP #
is the same iceberg number as given by the IIP in their annual bulletin though not every year used a numbering system, particularly in the earlier years. If an IIP number was not originally assigned then the records were just sequentially numbered in order to give the observation an ID number. Numbers are not necessarily consecutive.
The IIP recorded and numbered both sea ice and icebergs and in this database sea ice records are not included. Also, some records may have subsequently been deleted if they were shown to be duplicate or faulty sightings.
A decimal numbering system has also been used. If more than one iceberg size (large, small, etc) were present at the given location then each type was denoted separately such as 1.1, 1.2, etc. If only one iceberg size was present but between 2 (or more) locations then the first position was denoted as in 1.01 and subsequent positions as in 1.02, 1.03, etc. If more than one ice type was present between 2 (or more) locations then the first size in the first position was denoted as in 1.11 and subsequent positions as in 1.12, 1.13, etc., and the second size as in 1.21 to 1.22, 1.23, etc, and so on if more than two different sizes.
Column D Iceberg # and Column E Resight
These two columns are used to denote a resight, i.e. if a berg was recognized on a subsequent occasion. Normally, the Iceberg # is the same as the IIP # with a “N(o)” in the Resight column. If, however, the berg was a resight with a “Y(es)” in the Resight column then the Iceberg # refers to the IIP # of its original observation. Normally, a “Y” was only used if the original document claimed it was a resight. In certain cases such as in the fall months when icebergs can be very rare obvious repeat sightings have been denoted with a “Y” and a comment made in the Comment field.
Column F Sighting Source
For historical data a Ship is the most likely source with Miscellaneous for land observations such as from a lighthouse. Aircraft became common after World War 2.
Column G Vessel Name
Is the name of the ship, or occasionally used for the name of an observing lighthouse, or aircraft agency. If the type of ship is known then it is given the abbreviation is given in brackets after the name: SS = steamship; Sp = full masted sailing ship; Bk = bark; Bktne = Barkentine; Bg = brig; Bgtne = brigantine; Schnr – schooner;
Ycht = yacht; USN = United States naval ship; HMS = British naval ship.
Column H Sighting Method
For pre-World War 2 observations they were always visual. Radar became increasingly used after the war.
Column I Latitude & Column J Latitude
In degrees and minutes and all latitudes are North and all Longitudes are West. Generally, iceberg occurrence in the North Atlantic has been fairly well documented from about 1890 so in most cases iceberg reports lacking latitude and longitude have been omitted from the spreadsheets since there are many other reports to give an idea of the iceberg coverage and population. Prior to about 1890 iceberg information is sketchier becoming even more rare further back in time so any indication at all that there were icebergs observed in the area become important. For that reason all iceberg records have been retained with or without full geographic coordinates. The accuracy of the observation is another matter, as is the subsequent reporting, and it is unfortunately common for the same observation when reported in different sources not to entirely agree with each other.
Column K Ice Season
The IIP occasionally refers to the Ice Season which ran from October to the following September. This can lead to confusion and so in this case has been ignored altogether so the Ice Season here is the same as the calendar Year.
Column L Year & Column M Month
The calendar year and month.
Column N Date
Note that Excel only recognizes dates in date format from 1900. Prior to this an entry is regarded as just plain text.
Column O Time
The time as given in the original document which in most cases is likely to be ship’s time without reference to any standard.
Column P Size
The sizes used conform to the present day World Meteorological Organization’s (WMO) terminology of Growlers, Bergy Bits, Small Bergs, Medium Bergs, Large Bergs, and Very Large Bergs, with the additional generally accepted size of an Ice Island being a berg of at least 1000 feet (305 m) in length. The old mariners were not necessarily so exact consequently the size recorded in these Excel sheets was whatever was used in the original documents unless both heights and lengths were given to classify the size to the current terminology. Dimensions are, however, fairly rare and
in most cases icebergs were just referred to as icebergs or bergs regardless of size, and are called just Bergs in these files.
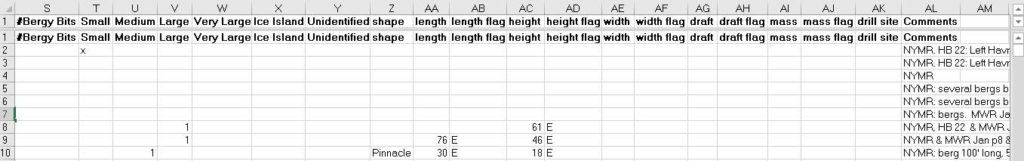
Columns Q – X
Are the numbers of bergs that fall into each of the categories: Bergs (size unknown), Growlers through Ice Islands. An “x” denotes bergs of an unspecified quantity.
Column Y Unidentified
Generally reserved for unidentified radar targets. May be occasionally used when ice origin (sea ice or iceberg) is in doubt or even if it is ice at all.
Column Z Shape
The shape is rarely described but when given the berg is classed in one of the established categories such as pinnacle, domed, blocky, wedge, etc.
Columns AA-AF, Dimensions and Flags
All dimensions are in meters, and in most cases the original description is given in the Comments fields. The Flag column denotes whether the dimension was “M(easured)” or “E(stimated)”. Unless specifically mentioned as measured the flag is given as Estimated. These dimensions fields are perhaps more appropriate for modern surveys where measurements have been specifically carried out, but nevertheless, many of the older records give dimensions to the nearest foot which implies that theodolites or other apparatus were often used. Occasionally, theodolites were specifically mentioned and so the Flag indicates the dimension as Measured.
Columns AG & AH, Depth and Flag
Similarly, the Depth Field is more appropriate for modern surveys, however, there were several occasions in which the berg was mentioned as being grounded in so many fathoms of water, the water depth either being known or measured by lead line, in which case the Flag indicates Measured.
Columns AI – AK, Mass, Flag, Drill site
These fields are really only relevant for modern studies and are largely unused. Unit is tons.
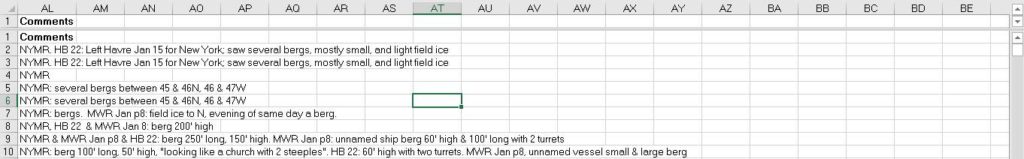
Column AL Comments
The reference for the source of the information is given here plus any other relevant information about the sighting or ice conditions. Occasionally, the iceberg position has been estimated or calculated from bearings from a known point in which case a comment is generally made. The compilation of data has been going on for many years and in the early days only the briefest of references was made, often without issue or page number, though this improved with time.
Reference Abbreviations
93 H. Rodman. Report of ice and ice movements in the North Atlantic Ocean. U.S. Hydrographic Office Publ. #93, 26p., 1890
CIS Canadian Ice Service, data set of Canadian Ice Distribution Survey on Index Cards available on Compact Disc
CSS Canadian Signal Service
HB Hydrographic Bulletin, U.S. Hydrographic Office, 1889, Government Documents, Record Group 289, Sn.Docs.N6.2, U.S. National Archives at College Park, College Park, MD
HH Halifax Herald, Halifax, NS, 1892
H.H. Lamb Climatic history and the future. Methuen & Co. Ltd, London, 1977, Vol.2, App. To Part III, V Suppl. Tables & figures, p.585, Table App.V.16 Exceptional positions of ice in the North Atlantic.
IIP International Ice Patrol
LL Lloyd’s List, London, 1741.
MWR Monthly Weather Review. United States War Office, 1872.
Newf Newfoundlander. St. John’s, Nfld., 1827.
NYH New York Herald
NYMR New York Maritime Register. New York, 1869.
NYT New York Times
PL Public Ledger and Newfoundland General Advertiser continued by Public Ledger, St. John’s, Nfld., 1823.
RG42 National Archives of Canada, Record Group 42, Marine Branch, Series C1, Vols. 371-372, File 22-4-0
SICDB Ship Iceberg Collision Database, at www.newicedata.com
Further remarks about the data.
The main sources and the time span in each are:
- New York Maritime Register pre-1880 to 1923
- Monthly Weather Review pre-1880 to 1895
- Hydrographic Bulletin Sep 1889 to 1947
- International Ice Patrol Annual Bulletin 1914 to 1959
While the 1959 monthly and annual tallies for icebergs crossing south of the 48°N are known, nearly all the individual records have been lost, so the handful of bergs listed in the file for the year are well short of the 694 known to have crossed. The International Ice Patrol Bulletin for 1959, however, has quite detailed ice charts.
The weekly Hydrographic Bulletins from mid-April 1893 until December 1894 are missing from the collection in the National Archives and no other location has been found.
Apart from, hopefully very few errors made in transcribing the data from the original sources, the data in the files are very much as reported in these sources. Occasionally, positions of icebergs were calculated from given distances and bearings (either magnetic or true) and in some instances approximations were made if one or the other (or both) were missing, and generally a comment added. Some rudimentary checks of iceberg positions have been made by plotting the data, and most of those found lying on land have been removed if it was not possible to rationalize the mistake. The main exception to this is observations from the lighthouses on Belle Isle, the small island in the Strait of Belle Isle that separates the island of Newfoundland from mainland Labrador to the north. The observations were frequently plentiful with no specific distances or bearings so frequently the geographic coordinates of the island itself were just used.
Simple checks for duplicate entries have been made and the duplicates removed, but identification can quickly become difficult when reported in different sources if the vessel name has been omitted and if there is further confusion as to dates and rounded-off coordinates. So, apart from removing the obvious such decisions have been left to the analyst.