Goal
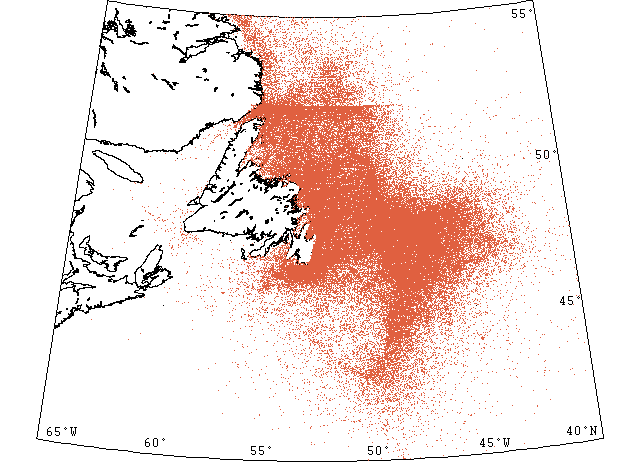
The objective was to record and digitize all historical iceberg observations in the North Atlantic Ocean made prior to the current modern era starting 1960. As a result well over 100,000 records were digitized.
During our search for ice records in compiling the Newfoundland Sea Ice Extent data we uncovered many observations of icebergs in a variety of marine journals and newspapers. The focus at that time was on sea ice over the Grand Banks in a season that lasted just a few months and was essentially over by the end of April. The iceberg season peaks May – June which was not only outside our initial time window but also icebergs could be found outside the peak period and in just about any month of the year. To capture all iceberg observations was thus outside our original focus but it was something that we returned to in subsequent years.
Summary of Sources
The formation of the International Ice Patrol (IIP) is the key component of iceberg observation in the North Atlantic after the sinking of the RMS Titanic in 1912. It is useful to define the era of ice observation as follows:
- Pre-IIP. Occasional ice reports were published in maritime newspapers such as Lloyd’s List and the New York Maritime Register. As ship technology and transit speeds improved along with speedier communications regular columns of Dangers to Navigation were published. In particular the weekly Hydrographic Bulletin of the U.S. Hydrographic Office, first published 1899, developed lengthy columns of ice information.
- IIP historical pre-digital era 1912-1959. The IIP commenced its annual reports, or bulletins, in 1914 but it was not until 1923 that it published a full listing of ice observations, both from its own reports and from transitory shipping. However, the Hydrographic Bulletin continued to publish ice observations throughout this early period of the IIP. By 1930 the IIP had become the established source of ice information. The authored article “Historical Data added to the Grand Banks Iceberg Database” discusses and compares the trend in iceberg observations during these early years of the IIP.
- IIP modern digital era 1960 to present. This data was digitized by the IIP and is available from the National Snow and Ice Data Center at https://nsidc.org/data/g00807 . While it is outside the scope of this work it is still very much relevant to the complete picture.
We were particularly fortunate here in St. John’s, Newfoundland to have easy access to a number of invaluable resources. The Maritime History Archives of Memorial University of Newfoundland has microfilm of many maritime newspapers including Lloyd’s List and the New York Maritime Register and the library of the local Department of Fisheries and Oceans had most of the IIP annual bulletins for the historical period. Most can now be found online at the digital archive, www.archive.org or the complete series can be downloaded from the IIP’s site, https://www.navcen.uscg.gov/?pageName=IIPAnnualReports . The Hydrographic Bulletin of the U.S. Hydrographic Office was accessed at the National Archives at College Park (NARA), Maryland.
A list of all sources with the abbreviations used in the files is available here at About the Excel Files.
About the Data
The iceberg data from our various sources up to 1959 is tabularized and presented in Excel files, basically one file for each year. The format was chosen to comply to another National Research Council Canada (NRCC) project with funding for the Program for Energy Research and Development (PERD) in which the modern IIP data along with other contemporary iceberg surveillance records in the Grand Banks of Newfoundland area of the North Atlantic were being compiled into a large searchable electronic database as a tool for the developing offshore oil and gas industry. This database is sometimes referred to as the PERD Iceberg Sighting Database. It was updated regularly with new records and also incorporated our historical data. However, being conceived with modern data in mind the template did not allow for certain topics, particularly the name of the transiting vessel, and any other relevant remarks, that may be of interest to the historian which thus consequently had to be omitted.
It was, therefore, our intention to eventually make those original Excel files available to the public by hosting them on our original website. However, in the latter part of the 2000’s decade we collaborated in the Syntheses of Sea-Ice, Climate and Human Systems in the Arctic and Subarctic (SYNICE) project of the Institute for Arctic and Alpine Research (INSTAAR), Boulder, Colorado, funded by the National Science Foundation(NSF). Our search for ice and iceberg information had already been underway for over 20 years by this time but the project funding now meant that the elusive Hydrographic Bulletin records could now be accessed at the only known source at NARA, Silver Springs.
The agreement with NSF included that they would make the data public and rather than having to determine what had been funded by NSF and what had not they generously agreed to host all the historic data from 1880 to 1959, essentially bracketing all the years covered by the bulletins. The files for those years can be downloaded in two zip files from https://data.eol.ucar.edu/dataset/106.400 , while the individual files for all years can be viewed or downloaded from the tables below. A description of all the various fields in the Excel files is contained with the zip files and is also available here at About the Excel Files.
The Data
Pre-1810 data, includes 1527, 1578, 1663, 1670, 1686, 1704, 1755, 1761,1776, 1783, 1787, 1792, 1794, 1803 and1807. Click on the following to download
- Pre-1810 Spreadsheet
- 1810-1819 Spreadsheet
- 1820-1829 Spreadsheet
- 1830-1839 Spreadsheet
- 1840-1849 Spreadsheet
- 1850-1859 Spreadsheet
- 1860-1869 Spreadsheet
- 1870-1879 Spreadsheet
- To access the 1880 – 1959 data please go to https://data.eol.ucar.edu/dataset/106.400
- To access the modern post-1959 data please go to https://nsidc.org/data/g00807
The names of the Ships providing the iceberg reports
The names of the ships involved in the Atlantic trade are occasionally of interest to maritime researchers and genealogists so for convenience ship lists are provided here by decade. If a ship of interest is found then the iceberg report can be located in the appropriate year indicated in the list by opening the spreadsheet file in the table above and using the search function.
Ship names prior to 1880
Ship names from 1880 to 1889
Ship names from 1890 to 1899
Ship names from 1900 to 1909
Ship names from 1910 to 1919
Ship names from 1920 to 1920
Ship names from 1930 to 1939
Ship names from 1940 to 1949
Ship names from 1950 to 1959
Iceberg Mapping Tool
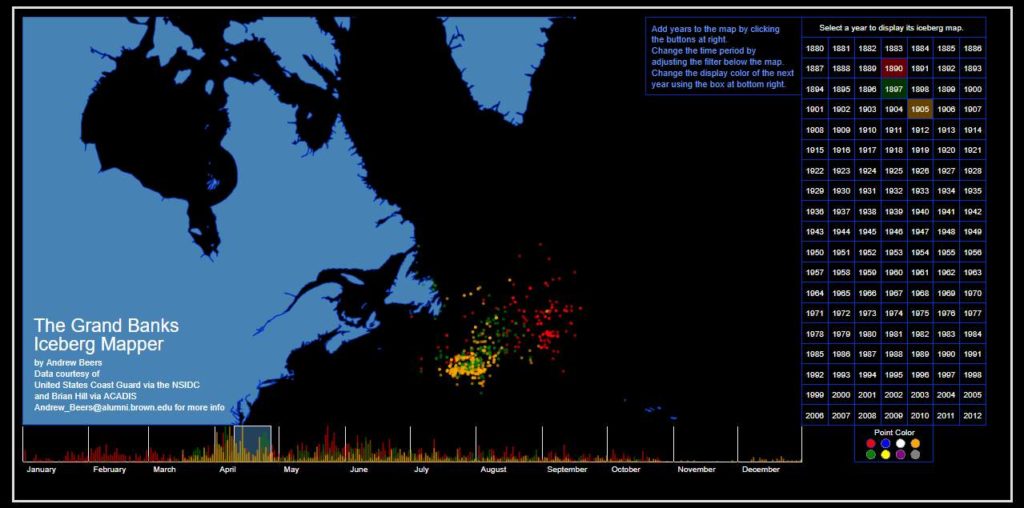
Based on the above data and for his thesis, Andrew Beers student and research assistant at Brown University, Rhode Island, developed a mapping tool to display the iceberg information. Time periods within a year can be easily selected and compared with other years. His work earned him Best Research Project and Library Innovation Prize as well as Magna Cum Laude. His mapper is available at: http://anderff.com/portfolio/2016/09/14/iceberg-mapper/